Kotlin Coroutines are often referred to as lightweight threads. The reason is that, in theory, a coroutine can consume less memory than a thread. Unfortunately, I’ve never seen any official numbers in this context, so I decided to build a benchmark to quantify the difference in memory consumption between threads and coroutines in Android apps. In this post, I’ll review the core ideas and challenges behind that benchmark and share its results.
Kotlin Coroutines in CPU and IO Bound Tasks
Right out of the gate we must acknowledge that the idea that Coroutines always consume less memory than threads is probably incorrect in general. When dealing with CPU bound tasks, the maximum throughput will be determined by the number of threads that the hardware can execute in parallel (as opposed to just concurrently). Therefore, if you use CoroutineDispatchers.Default for CPU bound work, it’ll yield a similar memory footprint to an equivalently configured thread pool. In practice, I even suspect that Coroutines framework will have slightly higher overhead than a thread pool.
The situation is different for IO bound work. If you use threads, then each task of this type will require a dedicated thread that might be blocked for prolonged periods. In contrast, Coroutines framework offers suspension feature which prevents an inactive coroutine from blocking a thread. Therefore, for example, if you have 10 concurrent coroutines which spend 90% of the time in the suspended state (e.g. waiting for data from the network), then, in theory, all 10 of these tasks can be executed on a single underlying thread. If you’d use threads directly in the same scenario, you’d need to instantiate and start 10 of them to get the same results.
My benchmark simulates pure IO bound tasks and measures the overhead of bare threads, coroutines and threads in a thread pool in these conditions. Since I don’t think there is a reason to believe that coroutines will have a better memory footprint than threads in CPU bound work, I didn’t bother to benchmark this scenario. If you’d like to benchmark CPU bound work, you can modify the source code of my benchmark to execute this type of tasks. Please share your findings if you do.
Challenges in Memory Benchmarking
In my previous article I compared the startup latency of threads and coroutines. Writing that benchmark wasn’t a trivial task by any means, but benchmarking memory consumption turned out to be much more challenging.
The root cause of most of the challenges is automatic garbage collection. See, when benchmarking memory consumption you want to have control over the memory. For example, when starting a new thread, you want to be sure that any change in the amount of the consumed memory is attributable to that thread. Unfortunately, automatic garbage collector is outside of your app’s control and can change the contents of the app’s memory at any instant. So, you can start a new thread and discover that the amount of memory consumed by the app actually decreased.
I spent a lot of time trying to work around this problem. For example, there is System.gc() call that I tried to use, but, since its effect isn’t deterministic, it didn’t help much.
Eventually, I opted for a very complex flow in my open-sourced TechYourChance app that seems to do the trick. First, I store the results of each iteration of the benchmark into a database. Then I restart the app’s process and return to the same screen. Then I run the next iteration of the benchmark. After all iterations complete, I retrieve all the results from the database and show them in the UI.
The assumption behind the above flow is that a restart of the application on a specific screen, without doing any other actions, brings the app into the same state in terms of memory consumption. There is no solid reasoning why this should be the case, but this assumption seems to hold in practice.
Coroutines vs Threads Memory Consumption Results
I ran the benchmark on two devices:
- Samsung Galaxy S7, which is the oldest device in my possession which is capable of running the TechYourChance app.
- Samsung Galaxy S20 FE, which is my current daily driver.
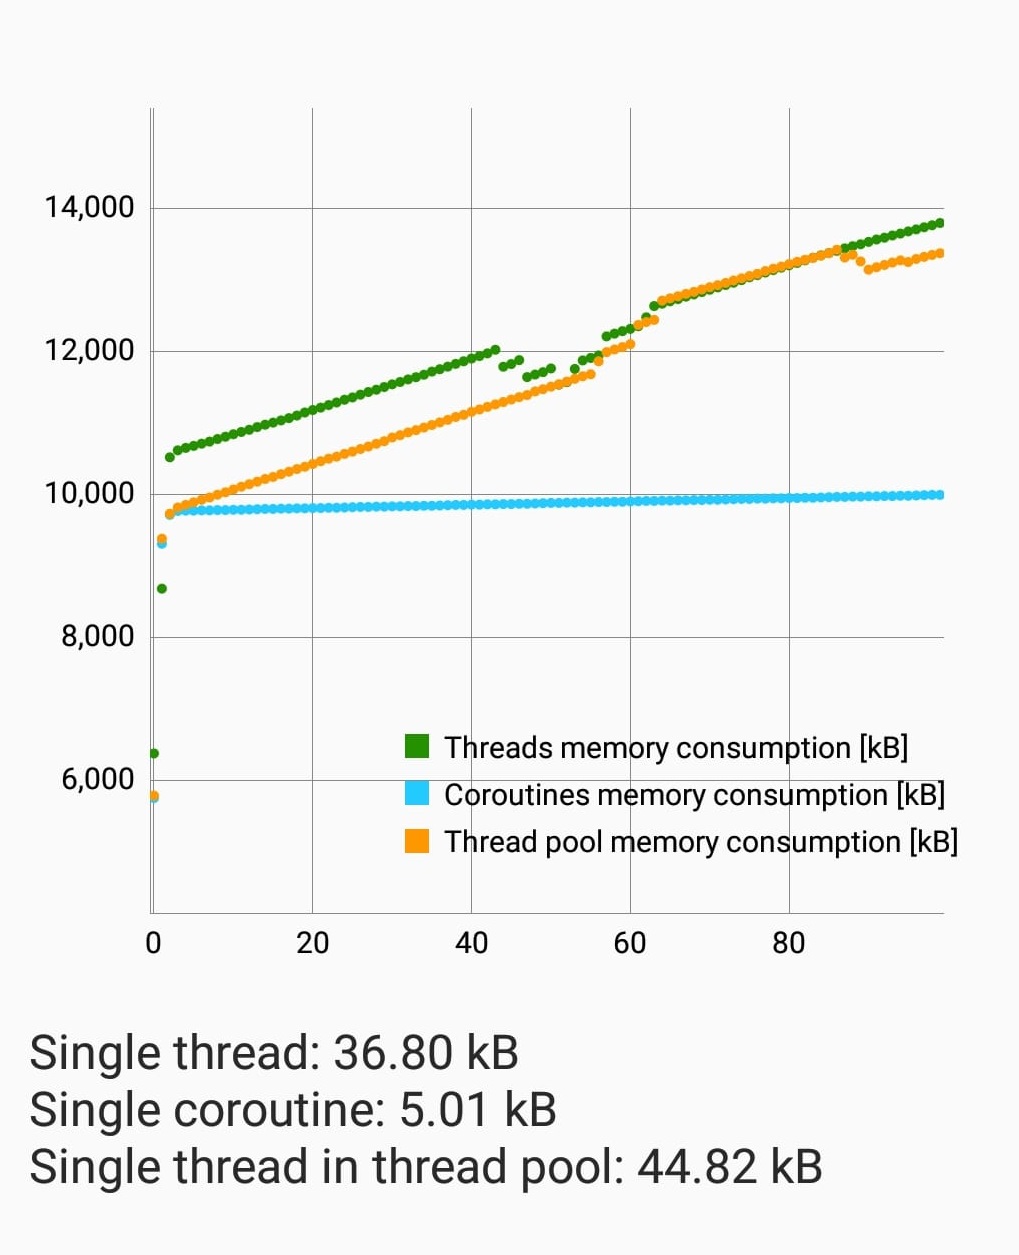
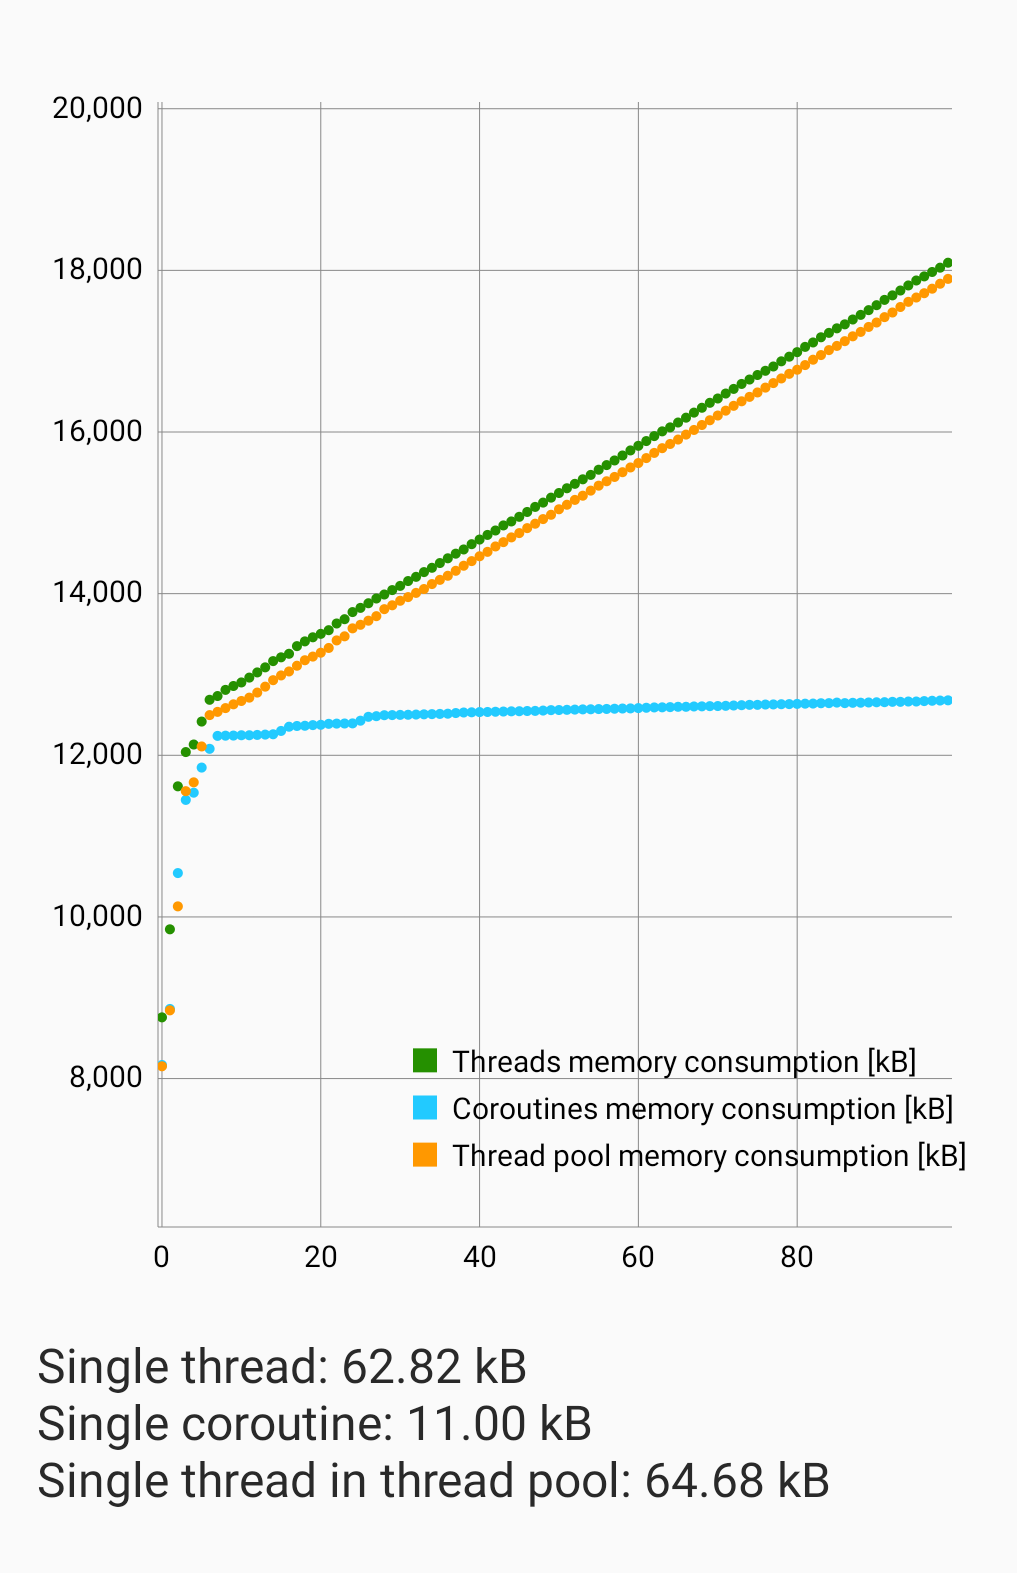
These are the results:


There are several interesting observations here.
First, note how the memory consumption by bare threads and by a thread pool align. This is exactly what I expected to see, so it gives me some confidence that this benchmark is relatively accurate.
We see a clear linear dependency of the total memory consumption on the number of started tasks. The slope of the linear fit to the respective data series gives us the amount of memory consumed by each additional thread or coroutine, which are displayed below the chart.
It’s interesting to note that threads and coroutines consume very different amounts of memory on different devices (probably also related to different versions of the Android OS). However, despite that, there seems to be relatively constant ratio of 6:1 in the consumed memory between a thread and a coroutine. That’s the magic number I’ve been looking for!
Conclusion
My benchmark shows that each live thread adds tens of kB to app’s memory consumption and that there is 6:1 ratio between the memory consumed by a thread and a coroutine. I’m really happy with these insights!
Note that even with 100s of IO bound tasks, which almost no Android app out there will ever need, the total difference in memory consumption between threads and Coroutines would be several megabytes. That’s nothing to lose your sleep over. Given most Android apps need no more than 10 concurrent IO bound tasks, the actual difference will be much smaller in most cases.
Therefore, my main takeaway from all these findings is that the fact that Coroutines are “lightweight threads” is pretty much irrelevant for Android developers. Unless you deal with some non-typical level of concurrency that involves hundreds of tasks, forget about this concern. Concentrate on building great products and writing clean and maintainable code. Leave the background work optimizations to the backend devs who deal with hundreds or thousands of concurrent IO requests.
As always, thank you for reading. If you liked this article, consider subscribing to my email list to be notified about new posts.
For your next article: “In testing the claim that self-driving cars save you on gasoline, my data reveals that the question is irrelevant if you’re just driving down the street to buy a stick of chewing gum.”
Bad and uninformative take, but it’s funny, so I leave it up 🙂
If you don’t want GC messing with your tests use the epsilon GC on the JVM.
-XX:+UnlockExperimentalVMOptions -XX:+UseEpsilonGC
just clickbaite article. There is no genuine curiosity to investigate both approaches. This articles are like this, you start by making a claim #1 am gonna prove coroutines are not more performant than threads. Then you do #2 Find corner cases that prove coroutines are not faster than threads. Ergo #3 Majority of android devs have misconception because i just proved by this idiotic corner case thats not the case. Good article